
Executing the 3-Point Turn Trade
With your understanding of all pieces of the puzzle and how they fit together, we will now take a look at the 3-point turn buy example from start to finish. All of the pieces of the puzzle now come together and help you execute this trade intelligently. Most of your skills will be needed before you even get into the trade so we will look at before, during, and after screenshots of the trade to better understand where everything goes.
The difference between this example and the previous two is that using layers made a big difference to the entry trigger, stop loss placement, and therefore risk:reward. We will continue to trade using just the single layer but now also start to consider the different options that the 2nd layer provides. With membership here at WaveFX Trading, you will learn how to effectively use more than 2 layers and it’s good for you to start slow and steady.
Before You Enter the Trade
So let’s live through the 3-point turn trade. You have understood from the market structure what type of trade you are expecting. You have decided at what location that type of trade would make sense. You now see an entry trigger at that location so you can take action. All of those details have been covered in these lessons and now we just need to look at the process of preparing for the trade. What do you know? What can you do with that information?

In the above screenshot, this trade has not yet triggered but you know what your entry price will be. You also know what your stop loss price will be and so, therefore, you know your risk. In this example, the risk on the trade if you were to take it is 210 pips. When it comes to the take profit the next 2 obstacles in the trades path are obvious. Due to the nature of this type of trade you can expect the higher high. The momentum behind that trade confirms that you could easily shoot for obstacle 2 if you wanted to. For the sake of this example, we will play it safe and shoot bang in the middle of that 2nd obstacle box for a slightly higher high. So now we know the reward on the trade which in this example is 230 pips. That gives you a risk:reward of just above 1:1 which is right around the minimum risk:reward requirement.
Placing a Safety Net
You now have a trade that is setting up at a good location with good structure behind it, you have an entry trigger that has presented itself, and the risk:reward makes the trade acceptable. At this stage that you see in the screenshot below; if price came down and passed the low of the indecision candle then your trade would be canceled, for now. If another indecision candle then formed without breaking the current stop loss location then you can plan the same again. If price heads up however and triggers your entry price then the stop loss will be where it is and there is also a safety net that can be decided upon at this juncture.
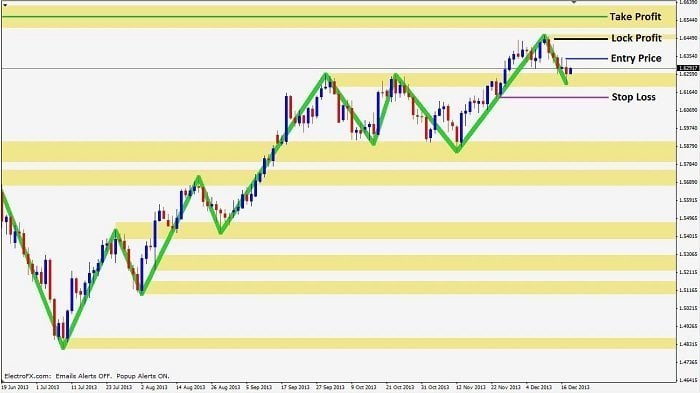
Obstacle 1 may not have been used as a take profit but it is still the home of a significant high that creates the first resistance box. It would be a shame to have that area hold and the trade turn around and head to your stop loss so this is a great place to move your stop loss to +1 pip or higher. We call this a lock profit trigger and it has been marked in the above screenshot. This lock profit area is a great place for you to receive an email so that you can come to the chart and see ‘how’ price arrived at it. Based on how price has arrived you will be able to decide if you want to move your stop loss to +1 pip, move your stop loss to lock in more profit that just the +1, or even just take profit there.
After You Have Entered the Trade
Now that the trade has entered and price has made it to your lock profit trigger you can asses how price arrived there. In the case of this 3-point turn trade, there was no hesitation at all on the way up and you can’t even make out a pullback. The only real new information you now have is that a fresh high was made at the green swing scale of movement, therefore the current green swing low is now a permanent feature on the chart until the end of time. If that low were broken then your trade would not be going according to plan so there is no need to have your stop loss any lower than that.
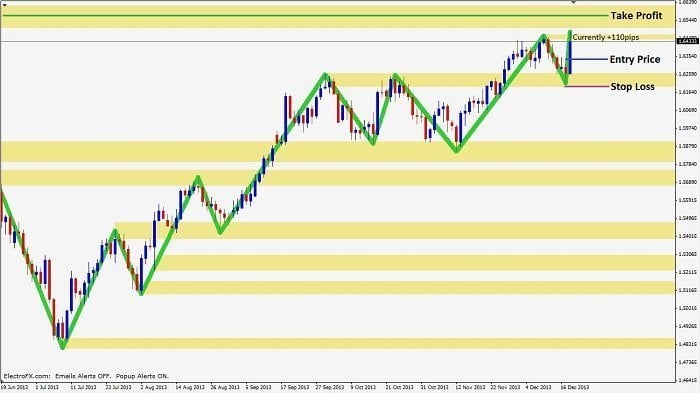
Keeping in mind that your trade is now at +110 pips at this juncture, and you risked 210 pips, plus price is moving strongly towards your take profit, exiting your trade here doesn’t make much sense. The option to move your stop loss to +1 pip is still there but without the ‘pullback and go’ you don’t have much to work with. If you are able to maintain logical thought then your only real new information is that new green swing high. This makes the green swing low the newest permanent addition to your evidence box. Based on logical thought we will now move our stop loss to the new, and now permanent, green swing low to reduce risk safely. There is also now an alternate entry trigger to discuss.
Alternate Entry Trigger, New Lock Profit
If you think back to your lesson on market layers you will remember that this was the only trade example where layers made a big difference for entry. In fact, it was a completely different location that was used for the entry trigger and the stop loss. This next screenshot shows you that entry. You should remember where the stop loss goes from the previous lessons, for now, we won’t complicate these images with the extra lines. At the time of the above screenshot, you have another way into the same trade or a place to add to your current position based on the new evidence that you can react to. Furthermore, we now have our ‘pullback and go’ style area forming and a new lock profit area is established.
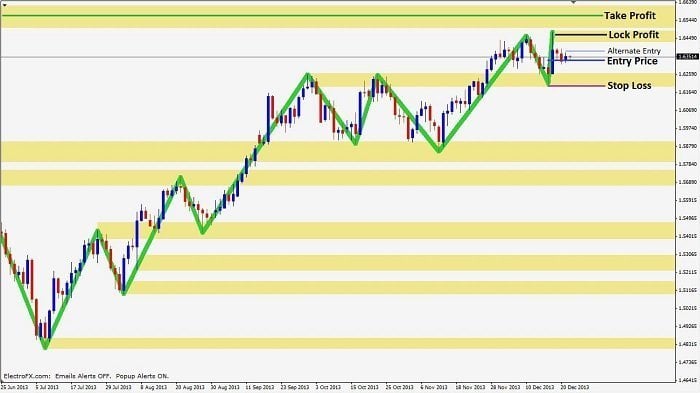
The alternate entry trigger aside; based on our original entry for this trade we now have had the first pullback. If you moved your stop loss to +1 at the previous juncture then this would be the end of your trade and you would have +1. There would be no shame in that and it would have just been an overly cautious move. You would just go back to waiting for the next setup. If you were able to remain objective though; the new position for your stop loss is where you see it in the above screenshot. If price heads on up from here then that will be your ‘pullback and go’ and this new lock profit area will be the next logical place for you to assess your trade. The fact that the first push up broke the previous green high is evidence that suggests the ‘pullback and go’ will push for a higher high than it just made.
The Next Juncture of the Trade
In this next image, you can see that price has now come back to the previous high that was made on the first push up. You can now assess once again how price got there and make your decisions. Price action is very much in your favor as this next run-up breaks the high of the first run. There is no reason not to expect this trade to reach your original take profit. The only real action to take here is to move your stop loss closer.
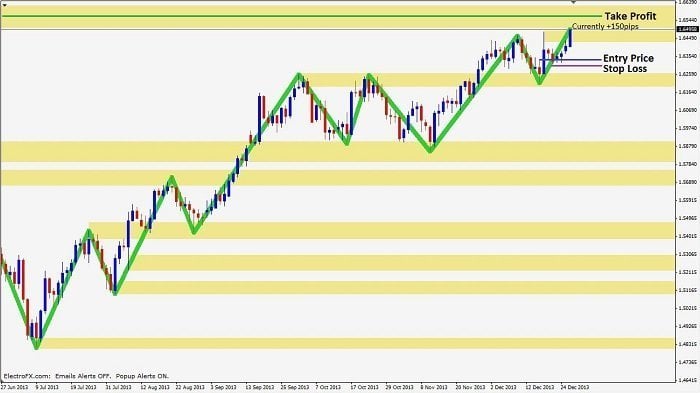
At this stage of the trade you are at +150 pips, still less than you risked so unless price has a hard time getting there, and was being rejected at the exact same location as that initial rejection, there is no reason to exit. With this trade price made a nice direct run on this next push up and has broken the high made by the initial push up. It should now be clear sailing up to your decided take profit and you now have an evidence-based move to make with your stop loss. Due to the current structure that you see in the image above, this new low on the faster layer, if broken, would indicate that momentum is shifting. There would be no reason to lose any more than the small amount of this new stop loss.
Trade Complete – Wait for the Next
In this next screenshot, price has made it to your take profit. A technically sound trade that was executed intelligently with maximum probability in your favor every step of the way. Even though this trade had a duration of 7 days, it could have been executed safely from start to finish with just a few minutes of your time using the WaveFX Trading Membership tools. These tools will execute, manage, and email you at the important decisive moments. These tools would have allowed you to plot out everything discussed in this lesson in minutes at the close of the daily candle (the decided entry trigger). In short, on your part, this trade would have taken you about 5 minutes of those 5 days.
There was a fair amount of new information in this example when compared to the previous examples. Make sure you understand it all correctly.
