What is This Custom Charting Software
MetaTrader only prides you with the most common types of charting option, candlesticks, bars, and line. For the daily chart and above you will find that candlestick charts are quite powerful. Once you try and trade faster things can get messy on those types of chart. They are definitely still tradable with the right skill level but we have found that Renko charts provide a clearer picture. Although Renko is our chart of choice, we have included a full custom charting package with membership. Each chart below has been created to show roughly the same amount of history so you can compare.
Renko Bar Charting

The Renko chart is based on a user-specified pip movement and has no time involved. A Renko bar could open and close in 10 minutes or 1 hour just like the range bar. The only thing that matters is the size of the price movement between the open and the close. This means that there will be more bars during high volatility trading and fewer bars during lower volatility trading. A Renko bar will always have its close at either its high or its low depending on direction. The next bar will always open next to the high/low range of the previous bar. In this custom charting software package you will also find options for Renko without wicks, Flex Renko, Hybrid Renko, and Median Renko.
Range Bar Charting

The range chart is based on user-specified pip movement and has no time involved whatsoever. A range bar could just as easily open and close in 10 minutes as it could in 1 hour. The only thing that matters is the size of the price movement between the high and the low. This means more bars during high volatility trading and fewer bars during lower volatility trading. A range bar will always have its close at either its high or its low depending on direction. The next bar will always open outside of the high/low range of the previous bar.
Tick Bar Charting

Tick charts are not time-based and they are not based on a specified pip movement either. The tick chart is instead based on trading volume and a user-specified amount of transactions, or incoming ticks. 233 ticks seem to be a favorite among day traders. This type of chart will be very different from broker to broker since they all have a slightly different tick feed.
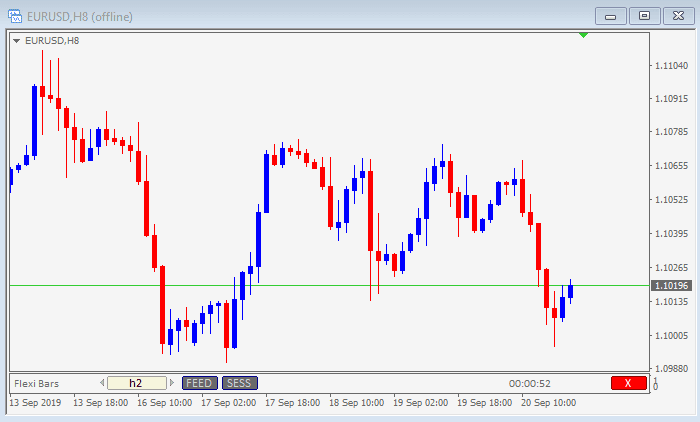
Flexible Period Charting

Metatrader 4 only offers you the following charts, MN, W1, D1, H4, H1, M30, M15, M5, and M1. As your skills develop you may wish to use an 8-hour chart, H8, or a 3-hour chart, H3. With this piece of software, you can create absolutely any timeframe that you like.
Point Original Charting

The Point-O chart is based on a user-specified pip movement and has no time involved. A Point-O bar could open and close in 10 minutes or 1 hour just like the Renko and range bar. The only thing that matters is the size of the price movement between the open and the close. This means that there will be more bars during high volatility trading and fewer bars during lower volatility trading. A Point-O bar differs from Renko at reversal points where the bars will be side-by-side.
Point & Figure Charting

Point & Figure charts come with an over 100-year history. To put that into perspective, they have been used extensively long before the computer. This type of charting was originally done on paper and each bar was made up of numbers. This then shifted to X’s, and then X’s and O’s. Rising columns, or bars, were made up of X’s and falling columns, or bars, were made up of O’s. This software has a choice of showing the X’s and O’s or turning them into bars.
